Technical Debt and Hidden Software Quality Issues: The Silent Valuation Killer in Private Equity Acquisitions
Why 65% of software acquisitions contain hidden technical debt that drains 23-36% of developer productivity and inflates valuation by 10-20%.
When a PE firm closes on a software acquisition, the real operational challenges often begin after champagne is poured. Of the 531 software acquisitions analyzed in recent M&A assessments, 65% contained software quality scores below market average, concealing what Software Improvement Group researchers call “the hidden killer”—technical debt that averages 31% of the entire acquired codebase. This hidden liability transforms what appeared to be a strategic acquisition into a value destruction machine, draining capital budgets, extending integration timelines, and delaying the realization of returns that justified the investment thesis.
The stakes for PE firms are particularly acute. Unlike traditional business acquisitions where operational risks are relatively contained, technical debt compounds across three dangerous dimensions: it inflates acquisition costs through overvaluation, it drains capital budgets post-close through unexpectedly expensive remediation, and it fundamentally constrains the scalability that PE value creation typically depends on. For Operating Partners, CFOs, and portfolio company CEOs responsible for value creation and technical due diligence, technical debt represents the single largest blind spot in the acquisition lifecycle—one that directly translates to diminished returns.
Why Technical Debt Remains Invisible Until Post-Close
Technical debt materializes when development teams trade long-term software quality for expedient delivery. A team might deploy a feature without comprehensive testing, use suboptimal architectural patterns to meet a deadline, skip documentation to accelerate release cycles, or patch security vulnerabilities without addressing root causes. Each decision saves time in the short term but creates compounding costs downstream—slower feature development, increased defect rates, higher maintenance burden, and constrained scalability.
The problem for PE acquirers: technical debt is fundamentally invisible during standard due diligence processes. A functioning software product appears performant and scalable during demonstrations. Revenue metrics look healthy. Customers report satisfaction. Yet beneath the surface, the codebase may be architecturally unstable, riddled with dependencies that constrain development velocity, laden with security vulnerabilities, or dependent on outdated technology stacks approaching end-of-life.
This invisibility persists because technical debt manifests not as an immediate crisis but as a gradual erosion of development productivity. The impact appears incremental: a feature that should take two weeks takes four weeks; QA cycles extend; bug escape rates increase; new developers require months to become productive; architectural changes trigger cascading system failures. Each friction point individually seems manageable. Collectively, they represent a 23-36% drain on engineering productivity.
Traditional financial due diligence captures none of this. Standard P&L analysis doesn’t reveal that 59% of developers’ time loss stems from technical debt rather than ineffective project management. Revenue multiples don’t reflect that scalability is fundamentally constrained by architectural decisions that would require millions in remediation to address.
The Valuation Impact: How Technical Debt Inflates Acquisition Costs
When technical debt remains unassessed during due diligence, it creates a systematic overvaluation dynamic that damages PE returns from day one.
The Hidden Liability Problem
PE firms value software acquisitions using revenue multiples, EBITDA multiples, and SaaS-specific metrics like Magic Number and Rule of 40. These multiples assume a baseline of operational efficiency—that the revenue being generated is sustainable and that the cost structure won’t unexpectedly deteriorate. Technical debt violates both assumptions.
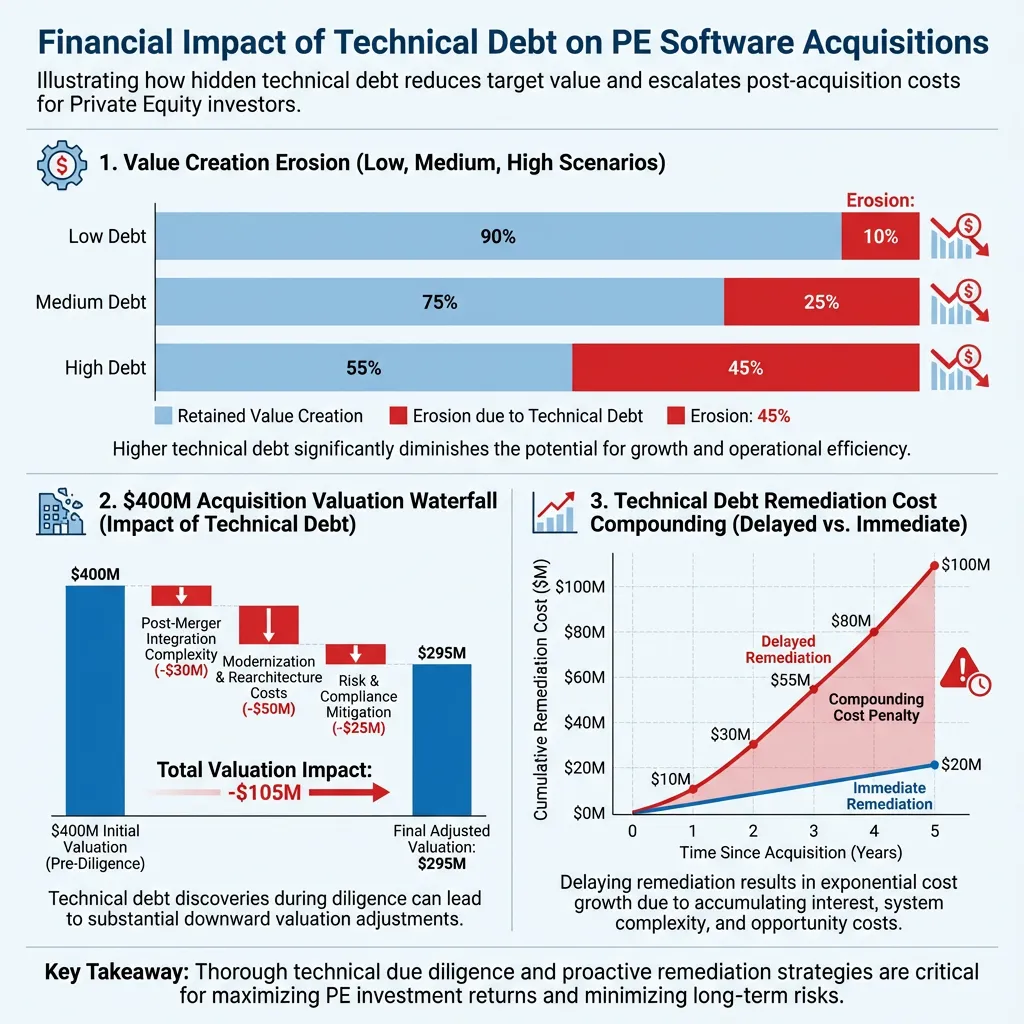
Consider a $50M ARR software company trading at 8x revenue for a $400M acquisition price. Standard financial analysis examines revenue growth rate (justifying the multiple), gross margins, customer acquisition cost, and churn. But it doesn’t examine whether current margins are sustainable given the engineering productivity drain from technical debt, or whether the revenue growth is achievable without substantial re-architecture.
In reality, if technical debt constitutes 31% of the codebase—the SIG average—the software is consuming 31% of development capacity for maintenance, remediation, and working around constraints rather than generating new revenue. The acquirer is implicitly purchasing a company that operates at 69% engineering efficiency rather than the baseline assumed in valuation multiples.
This efficiency gap directly impacts the acquirer’s assumptions about post-close margin expansion. If the acquisition thesis projects 3% annual EBITDA margin improvement through operational efficiency, but 31% of engineering capacity is consumed by technical debt, achieving that margin expansion becomes mathematically impossible without first addressing the debt. The acquirer has paid for margin expansion that technical debt makes unattainable.
The Underwriting Arbitrage Failure
PE firms conducting technical due diligence often encounter a perverse incentive structure. Engaging serious technical assessments—source code analysis, architecture review, security assessment—costs $50,000-$200,000 and extends the diligence timeline by 4-8 weeks. Sellers, concerned that thorough technical diligence will uncover hidden liabilities and reduce their valuation, pressure for expedited closings and threaten to entertain competing offers if diligence extends.
This timeline pressure creates an asymmetric information problem. Sellers have spent years living with technical debt and understand its constraints intimately. Buyers, constrained by competitive deal pressure and board approval timelines, often elect to proceed without comprehensive technical assessment. The result: PE firms systematically overpay for software assets whose true operational costs only become apparent post-close.
This dynamic is particularly pronounced in competitive sale processes where multiple PE buyers are bidding for the same asset. The willingness to forgo rigorous technical assessment becomes a competitive advantage in deal-chasing, even as it destroys value post-acquisition.
Quantifying the Overvaluation
The financial impact manifests in three ways:
First, the margin expansion component of the acquisition thesis becomes unattainable. If the deal models 300-400 basis points of EBITDA margin improvement and 30-40% of engineering time is consumed by technical debt, approximately 1-1.5% of the projected margin improvement cannot be achieved without addressing technical debt first. On a $50M revenue business, this represents $500K-$750K in annual EBITDA erosion relative to the acquisition thesis.
Second, remediation costs become a surprise capital expense not accounted for in the deal model. If technical debt remediation requires $2-5M in upfront engineering investment (typical for moderate debt in a $30-100M revenue business), the acquirer experiences an unexpected cash drain that either compresses exit multiples or extends the hold period to recover ROI.
Third, the time value of money tilts dramatically against the PE firm. If remediation extends the value creation timeline by 12-24 months—or worse, prevents achievement of revenue growth targets because development velocity remains constrained—the 5-7 year hold period delivers sub-target returns. For a typical software buyout targeting 3-4x MOIC over five years, a 12-month delay in achieving exit readiness can reduce realized returns by 15-25% in net present value terms.
In aggregate, technical debt typically reduces the true acquisition value by 10-20% of the purchase price. A $400M acquisition of a software company with 31% technical debt might have a true value closer to $320-360M after accounting for the hidden costs of remediation and the margin expansion that becomes impossible without first addressing debt.
The Post-Close Cost Explosion: What Hidden Technical Debt Actually Costs
Post-close, the true financial impact of hidden technical debt becomes painfully apparent through multiple value-destroying mechanisms.
Developer Productivity Drain
The most immediate and quantifiable impact: developers waste 23-36% of their working time on activities forced by technical debt rather than generating new revenue. For a software company with 100 engineers, this represents 23-36 FTE worth of capacity lost to non-productive work.
Research from Chalmers University of Technology analyzing software developer productivity found that technical debt forces developers to spend significantly more time on:
- Additional testing: Developers must perform more comprehensive manual testing because automated test coverage is insufficient (often due to architectural constraints that make testing difficult)
- Code analysis and refactoring: Understanding legacy code, tracing dependencies, and working around architectural constraints consumes substantial time
- Bug investigation and fixing: Defects in high-debt codebases require longer diagnosis and resolution cycles because root causes are obscured by architectural complexity and interdependencies
- Waiting for system builds and deployments: Complex, tightly-coupled architectures extend build times and increase deployment risk, slowing feedback cycles
The financial impact scales directly with team size. For a 50-person engineering team, 23-36% productivity loss represents $1.8-2.9M in annual unproductive engineering expense. For a 150-person engineering team, the same productivity drain costs $5.4-8.6M annually.
This drain directly conflicts with PE value creation models. If the acquisition thesis projects 20% engineering headcount growth to deliver 30% ARR growth, but existing technical debt prevents achieving that growth rate without architectural remediation, the company fails to hit revenue targets. Instead of revenue growth funding margin expansion, the company experiences margin compression because it cannot expand revenue at the assumed rate.
Development Velocity Collapse
Technical debt doesn’t merely slow development—it progressively paralyzes it through a mechanism economists call “productivity compounding.”
A feature that should require two weeks of development in a clean codebase might require four weeks in code with moderate technical debt and six weeks in code with severe debt. As debt accumulates, development velocity doesn’t decline linearly—it collapses geometrically. By the time technical debt reaches 50%+ of a codebase, feature development often becomes nearly impossible without substantial rework.
The impact on value creation is severe. If the acquisition thesis projects annual feature delivery roadmaps—critical for competitive positioning and upsell to existing customers—but technical debt constrains feature velocity below forecasted levels, the company misses product roadmap milestones. Delayed feature releases translate directly to:
- Delayed revenue recognition from customers waiting for committed features
- Increased customer churn as competitive products ship features faster
- Reduced customer acquisition when the product roadmap lags competitors in key capability areas
For a SaaS business with $50M ARR and typical $5K customer ACV, a 10% churn increase (from 7% to 17%) represents $2.5M in lost annual recurring revenue—potentially derailing the entire value creation thesis.
The Rip-and-Replace Decision: The Ultimate Capital Drain
In some cases, technical debt reaches a threshold where remediation becomes impossible—the architecture is so constrained, so dependent on outdated technology, or so badly designed that addressing it requires essentially rewriting the entire system. This forces the PE-backed company into a binary choice: continue operating in the constrained environment and accept stunted growth, or embark on a rip-and-replace project—complete system replacement.
Rip-and-replace projects represent a capital disaster for PE firms. These initiatives typically require:
- $1-5M in external consulting and engineering costs (depending on system complexity)
- 12-24 months of engineering effort with parallel system maintenance (because the old system must continue operating)
- Zero feature development during the replacement period while engineering resources are diverted to the new system
- High execution risk—replacing complex systems has extremely high failure rates, with many organizations discovering too late that the new system doesn’t replicate all critical functionality
The opportunity cost is staggering. If a software company with $30M ARR experiences a 24-month rip-and-replace project consuming 70% of engineering capacity, the company generates essentially zero new features during that period. In a competitive market, this translates to revenue stagnation or decline while competitors ship features and gain market share.
For PE investors, rip-and-replace is essentially admitting that the acquisition assessment failed. The firm paid full value for software that turned out to be fundamentally non-scalable, then invested millions more to fix it. The delayed returns associated with the rip-and-replace project often push the hold period from 5-7 years to 8-10 years, or result in a discounted exit at multiples lower than would have been achieved without the debt-driven complications.
Integration and Separation Complexity
Technical debt also destroys value through operational and transaction complexity.
During integration: When PE acquires multiple software assets with the goal of consolidating them into a unified product platform, technical debt in individual assets often makes consolidation impossible. If Company A’s codebase is tightly coupled to outdated technology and Company B’s codebase uses a different architecture, combining them typically requires substantial re-architecture—driving up integration costs and extending timelines.
During separation or carve-outs: PE firms sometimes decide to separate a portfolio company from the broader PE platform or divide a business into multiple independent operating companies. Technical debt makes separation exponentially more expensive. If the system architecture is tightly coupled, with data models and dependencies distributed across numerous components, extracting the company into a separate operating system requires extraordinary engineering effort.
In both cases, technical debt that would have been largely irrelevant in a standalone business acquisition becomes a material value destroyer when integration or separation is part of the PE strategy.
Detecting Technical Debt: Why It Evades Standard Due Diligence
The reason technical debt remains hidden during most PE acquisitions is that standard due diligence processes don’t look for it.
What Traditional Due Diligence Captures
Financial due diligence examines revenue, COGS, OpEx, and working capital—none of which directly surface technical debt issues. A software company might report 40% gross margins, but those margins might be artificially suppressed because 30% of engineering time is spent on technical debt remediation rather than cost-effective features that could improve margins.
Customer due diligence interviews key accounts to assess stickiness and expansion potential. But customers typically don’t discuss internal technical debt—they discuss feature completeness, pricing, support quality, and reliability. Unless technical debt manifests as outages or feature gaps, customers don’t volunteer information about it.
Operational due diligence reviews organizational structure, management team, and operational processes. It often includes some assessment of development practices, but rarely extends to actual code quality assessment or architectural review.
The Missing Technical Assessment
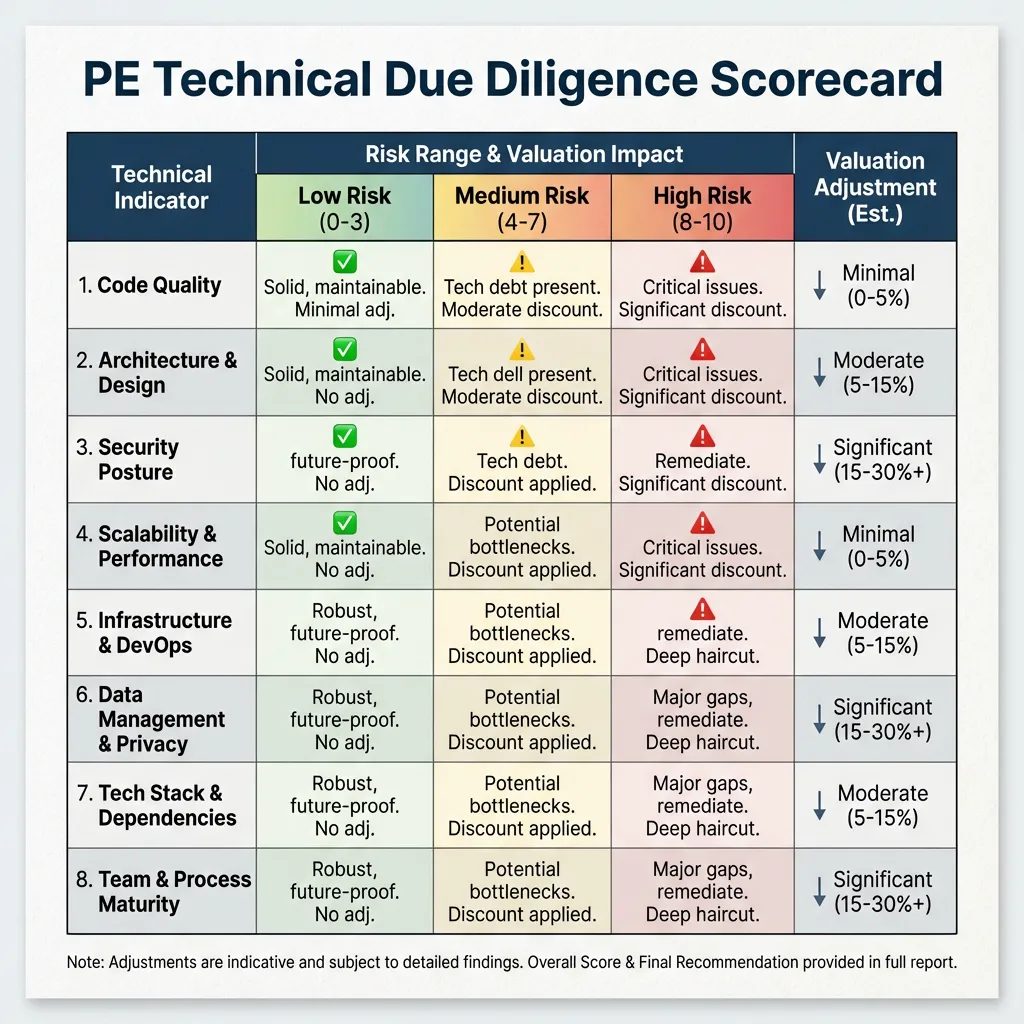
Truly identifying technical debt requires what the industry calls “technical due diligence”—a process that directly examines the software’s code, architecture, and development practices. This assessment typically includes:
- Static code analysis: Using automated tools to scan the codebase for quality issues, security vulnerabilities, dependency problems, and architectural red flags. This generates a technical debt ratio (TDR)—a quantified measure of the percentage of engineering effort currently consumed by technical debt versus productive work.
- Architecture review: Evaluating system design decisions, identifying tightly coupled components, assessing scalability constraints, and identifying technical decisions that will become increasingly problematic as the system scales.
- Security assessment: Identifying security vulnerabilities, outdated cryptographic practices, insecure dependency chains, and security architecture gaps.
- Development process evaluation: Assessing whether the organization follows software engineering best practices—automated testing, code review processes, documented deployment procedures, incident response capabilities.
- Legacy technology assessment: Identifying whether the system depends on outdated technology stacks, languages approaching end-of-life, or third-party components no longer receiving security updates.
The reason these assessments remain rare in PE acquisitions is cost and timeline. Comprehensive technical due diligence costs $75,000-$250,000 and requires 3-6 weeks of specialized expertise. In competitive deal environments with aggressive timelines, PE firms often make a rational economic decision: forego comprehensive technical assessment, reduce purchase price slightly to absorb estimated technical risk, and proceed with the deal.
This calculus only works if technical debt risk is actually small. In practice, with 65% of acquired software containing below-average code quality and 31% average technical debt burden, the statistical risk of hidden technical debt is substantial.
The Financial Quantification: Measuring Technical Debt Impact
For PE decision-makers evaluating technical debt risk, quantification follows a relatively straightforward framework:
Technical Debt as a Productivity Tax
The foundation of technical debt quantification is measuring its drag on engineering productivity. Research across multiple organizations provides remarkably consistent findings:
- Developer surveys report 23-36% of time wasted due to technical debt
- Additional testing and code analysis are the primary time consumers
- Complex architectural debt generates the highest productivity impact
- The impact scales with codebase age and size
From this baseline, PE firms can estimate the annual cost of technical debt:
Annual Technical Debt Cost = (Number of Engineers) × (Average Developer Salary) × (Productivity Loss %) × (% Attributable to Technical Debt)
For a company with 75 engineers at $180,000 average total compensation with estimated 35% productivity loss and 80% of that attributable to technical debt:
Annual Cost = 75 × $180,000 × 35% × 80% = $3.78M annually
This represents engineering capacity equivalent to 21 full-time engineers consumed by technical debt rather than generating revenue or cost reduction.
Technical Debt Interest Rate: The Compounding Cost
Technical debt has a critical property: it compounds. As technical debt accumulates, it becomes harder to address. The “interest rate” on technical debt—the rate at which it consumes increasing fractions of engineering capacity—typically ranges from 15-50% annually depending on the organization’s development velocity and the types of debt accumulating.
This means that if a company has $5M in estimated technical debt remediation costs today, and the interest rate is 20% annually, the cost to remediate grows to:
- $6M in one year (original $5M + $1M in compounding costs)
- $7.2M in two years
- $10.5M in five years
The implications for PE value creation are severe. Delaying technical debt remediation by even 12-18 months materially increases the eventual remediation cost. A company with $3M in current technical debt that delays remediation for two years faces $4.3M in remediation costs instead—representing $1.3M in value destruction from delay alone.
Integration Cost Analysis: Refactoring vs. Rip-and-Replace
When technical debt reaches severe levels (typically 40%+ of codebase), PE firms face a critical decision: invest in refactoring and gradual remediation, or undertake a rip-and-replace initiative.
Refactoring economics typically require:
- $1-3M in engineering investment over 12-24 months
- Parallel feature development continues during remediation (reduced velocity)
- Estimated payback period: 18-36 months through productivity improvements and revenue acceleration
- Risk profile: Medium (execution risk is lower, but benefits take time to materialize)
Rip-and-replace economics typically require:
- $2-6M in external consulting and engineering costs
- $3-8M in internal engineering resource costs (diverted from feature development)
- 12-24 month project timeline with zero feature development in core system
- Estimated payback period: 24-48 months (if successful) or total failure if execution falters
- Risk profile: High (execution risk is substantial, and cost overruns are common)
For PE investors, the rip-and-replace scenario is typically a value destruction event. The only scenario where rip-and-replace makes financial sense is if the existing system is so constrained that remediation is impossible, the new system can be built at substantially lower cost than estimated remediation, and market timing allows a 12-24 month feature development pause without competitive or customer impact.
These conditions are rarely met, which is why the best financial outcome is always to identify technical debt pre-acquisition and either eliminate it through purchase price adjustment, prioritize its remediation into the first-year investment plan, or decline the acquisition entirely if debt burden exceeds acceptable levels.
Case Study Implications: Why Thorough Technical Assessment Reshapes Deal Economics
The difference between PE acquisitions with rigorous technical assessment and those without is substantial.
Consider two hypothetical acquisitions of comparable $100M ARR SaaS companies:
Acquisition A (No Technical Assessment)
- Purchase price: $750M (7.5x revenue multiple)
- Assumed EBITDA margin: 25%
- Year 1 post-close: Technical assessment reveals 35% technical debt, 30% engineering productivity loss
- Revised margin estimate: 20% (due to technical debt remediation costs)
- Actual EBITDA: $20M instead of $25M
- Required remediation investment: $4M
- Value creation shortfall: $9M relative to acquisition thesis (lost $5M EBITDA + $4M remediation cost)
Acquisition B (With Technical Assessment)
- Pre-acquisition technical assessment reveals 35% technical debt
- Estimated remediation cost: $4M
- Revised purchase valuation: $730M (7.3x revenue multiple, adjusted down 3% for technical risk)
- Negotiated provision: $4M remediation reserve in seller note or holdback
- Year 1 post-close: Technical debt remediation completed; engineering productivity normalizes
- Margin trajectory: 23% Year 1, 25% by Year 2
- Value creation: Aligned with acquisition thesis
- Buyer advantage: $20M purchase price reduction + proper capital allocation for remediation
The difference: $20M in acquisition price avoidance (vs. Acquisition A) plus preservation of the revenue growth trajectory. Over a 6-year hold period, this difference likely translates to 5-15% higher realized MOIC.
The Framework: Assessing Technical Debt During Due Diligence
For PE firms integrating technical assessment into acquisition decisions, the framework includes:
Phase 1: Rapid Technical Screening (Days 1-5)
Before investing substantial resources in comprehensive assessment:
- Automated code quality scans using industry-standard tools (SonarQube, CAST, or equivalent) across the entire codebase
- Architecture interviews with the CTO and senior engineers asking about known constraints, architectural decisions, and technical priorities
- Technology stack assessment identifying obsolete technologies, approaching end-of-life components, or significant technical debt areas
- Development process review examining testing practices, deployment procedures, code review rigor
Output: Technical Debt Ratio (TDR) estimate; identification of high-risk areas requiring deeper investigation
Phase 2: Deep Dive Assessment (Weeks 2-4)
For acquisitions progressing to serious consideration:
- Comprehensive source code analysis of high-risk modules identified in Phase 1
- Scalability assessment examining whether system architecture can support 2x-5x revenue growth without re-architecture
- Security assessment including dependency scanning, vulnerability assessment, and security architecture review
- Integration feasibility study if multi-asset consolidation is planned
- Cost-benefit analysis comparing remediation costs against benefits and timelines
Output: Quantified technical debt burden; estimated remediation roadmap and costs; revised valuation with technical risk adjustment
Phase 3: Financial Modeling (Week 5+)
Integrating technical assessment into financial models:
- Adjusted EBITDA margin projections accounting for technical debt remediation costs
- Engineering productivity impact on feature development velocity and revenue growth timelines
- Scenario analysis comparing outcomes with and without technical debt remediation
- Capital allocation planning integrating technical debt remediation into first-year investment plan
Output: Revised acquisition thesis accounting for technical risk; purchase price adjustment justification
Actionable Recommendations for PE Investment Teams
Based on current market data and technical debt prevalence, PE firms should:
-
Implement Mandatory Technical Assessment for All Software Acquisitions Above $50M Purchase Price Given that 65% of acquired software contains below-average code quality and 31% average technical debt, the statistical case for assessment is overwhelming. At current assessment costs ($75K-$250K for comprehensive review), the investment in thorough assessment represents less than 0.1% of typical acquisition size—insurance against a 10-20% valuation risk.
For acquisitions below $50M, implement rapid technical screening (Phase 1 assessment) to identify whether deeper investigation is warranted.
-
Build Technical Diligence Expertise In-House or Through Retained Advisors Given the frequency of technical debt in acquired assets and its material impact on returns, PE firms should either:
- Hire Chief Technology Officers or technical due diligence leaders embedded in investment teams
- Establish relationships with specialized technical due diligence firms (such as SIG, CAST, or equivalent) for rapid assessment capabilities
- Create standardized assessment rubrics and checklists enabling investment professionals to conduct preliminary technical screening
This expertise investment pays for itself through more accurate valuations and better integration planning on the first technically complex acquisition.
-
Incorporate Technical Debt Metrics into Post-Close Operating Plans For software acquisitions, the operating plan should include:
- Technical debt remediation roadmap prioritizing high-impact, high-cost debt areas
- Development velocity targets accounting for technical debt remediation investment
- Engineering productivity metrics tracking the effectiveness of technical debt reduction efforts
- Feature delivery cadence with realistic timelines that account for technical constraints
These metrics should be monitored monthly by the Operating Partner and Board, equivalent to financial KPI tracking.
-
Adjust Acquisition Multiples for Technical Debt Risk Rather than using identical revenue multiples across all software acquisitions, develop a technical risk adjustment framework:
- Base Multiple: 7.5x (industry average for quality software)
- Adjustments:
- Technical Debt Ratio <10%: +10% (premium for high-quality codebase)
- Technical Debt Ratio 10-20%: 0% (at-market)
- Technical Debt Ratio 20-30%: -5% (quality risk)
- Technical Debt Ratio 30-40%: -10% (material quality risk)
- Technical Debt Ratio >40%: -15% or acquisition decline (severe quality risk)
This framework creates economic incentives for sellers to address technical debt pre-sale (improving valuation) while protecting PE buyers from overpaying for hidden liabilities.
-
Use Technical Debt Assessment as a Competitive Advantage in Deal Negotiations PE firms that have identified technical debt through rigorous assessment can:
- Justify lower purchase prices by quantifying technical remediation costs
- Negotiate purchase price holdbacks or earnouts tied to technical performance metrics
- Establish seller representations and warranties around code quality and technical performance
- Build credibility with sellers by demonstrating thorough understanding of technical assets versus competitors conducting superficial assessment
This approach often enables deal closure with better terms and lower risk than competitors who failed to assess technical risk.
Conclusion: Technical Debt as a Strategic Differentiator
The PE firms that outperform peers in software investing increasingly recognize that technical quality is inseparable from financial quality. A software company with high revenue growth but high technical debt is fundamentally riskier than a comparable company with equivalent revenue growth and low technical debt.
The market has begun to price this in. Top-quartile PE deals increasingly include rigorous technical assessment, while bottom-quartile deals that ignored technical risk experienced material underperformance. The firm that can systematically identify technical debt, properly price it into acquisitions, and execute remediation roadmaps post-close will systematically outperform peers in software deal returns.
For Operating Partners, portfolio company CFOs, and investment professionals responsible for technical due diligence, the evidence is overwhelming: technical debt assessment is not an optional luxury—it’s a fundamental value creation lever that separates successful software investments from failures.
By implementing rigorous technical assessment, adjusting valuations for technical risk, and building technical diligence expertise into deal teams, PE firms can transform technical debt from a hidden liability that destroys value into a visible, manageable risk factor that can be priced, remediated, and eliminated.
The alternative—proceeding without proper technical assessment—is increasingly indefensible in an investment environment where technical debt has become the dominant value destroyer in software M&A.
References and Source Data
- Software Improvement Group analysis of 531 M&A transactions; 65% contained below-average software quality scores, with 31% average technical debt burden (2024)
- Developer productivity research: Chalmers University study finding developers waste 23% of working time on technical debt; related research showing 36% productivity loss in organizations with high debt burden (2017-2025)
- Stripe Developer Coefficient Report: 33% of developer time wasted on technical debt (2024); survey data from 500+ developers indicating 8+ hours weekly lost to technical debt
- Shift Magazine/Developer Survey: 59% of developers cite technical debt as primary cause of time loss; additional research showing 20% annual productivity impact across large software organizations (2024)
- Software Improvement Group database analysis of 200 billion lines of code across 18,000 system inspections; technical debt constitutes average 31% of acquired codebases in M&A transactions (2024)
- Additional sources: Bain & Company Private Equity Report 2025; McKinsey M&A Trends 2024-2025; EY-Parthenon Software Due Diligence Analysis (180 deals); Carnegie Mellon University software engineering research; PwC Technical Debt in M&A Assessment (2024)