Software Licensing Redundancy and Cost Optimization: The 48% Hidden EBITDA Opportunity PE Firms Systematically Overlook
Why PE-backed companies waste 48% of their software budgets on unused licenses, and how to capture this 4-7% EBITDA improvement opportunity.
When a PE firm closes on a software development company, SaaS business, engineering-intensive manufacturer, or technology services firm, it inherits not just operating businesses but collections of software licenses—often redundant, overlapping, underutilized, and massively expensive. A manufacturing company running CAD, CAE, EDA, and simulation licenses on seats that sit idle 60% of the time. A software company paying for cloud infrastructure that’s over-provisioned by 40%. A financial services firm maintaining competing data analytics platforms with overlapping functionality. A healthcare technology company with expired or unused concurrent licenses they’re still paying annual maintenance fees on.
The financial scale of this waste is staggering: organizations with more than 200 employees waste nearly 48% of their software budgets—an average of $235,000 annually—on redundant, underutilized, or overlapping licenses. For large enterprises, Zylo’s 2024 report found that 55% of enterprise software licenses go unused, resulting in an average of $127.3 million in wasted spend annually. For PE-backed companies where software licensing represents 8-15% of operating expenses, a 48% waste rate represents an immediately available 4-7% EBITDA improvement opportunity—no operational changes required, no revenue growth needed, just cost optimization.
Yet PE firms treat software licensing as a post-close operational concern rather than a pre-close value creation opportunity. Standard practice: financial due diligence reviews purchasing patterns but rarely quantifies license waste or redundancy. Operational due diligence may inventory systems but doesn’t assess utilization rates. Only 38% of organizations are confident in their ability to collect accurate product usage data, with 62% lacking systematic approaches to tracking software utilization. For PE firms, this represents a massive blind spot: the difference between identifying and capturing a 4-7% EBITDA improvement opportunity at close versus discovering it months later after integration efforts have already begun.
This article deconstructs the software licensing redundancy and cost optimization opportunity in PE acquisitions: why licenses accumulate and proliferate, what specific licensing patterns create the highest waste, how to quantify underutilization and redundancy during due diligence, what the true optimization opportunity represents in terms of EBITDA and returns, and how to structure licensing audits and renegotiations to capture this value immediately post-close.
Why Software Licenses Accumulate and Create Waste
Software licenses accumulate wastefully through predictable mechanisms that repeat across industries and company sizes.
Mechanism 1: The “Just-In-Case” Over-Provisioning Bias
When procurement teams lack visibility into actual software usage, they systematically over-purchase licenses. The logic: “We have 100 employees, so we need 100 licenses in case everyone uses the software simultaneously. Better to over-buy than risk people not having access when they need it.”
This logic overlooks the reality that peak concurrent usage is typically 40-60% of headcount for most enterprise applications. An organization with 100 employees and 100 seats of enterprise software usually sees 40-60 simultaneous users at peak. During slow periods, usage drops to 20-30%. Over-purchasing for theoretical peak demand creates 30-50% wasted license capacity.
Real-world example: A consulting firm with 200 employees purchased 200 licenses of specialized CAD software because the original procurement decision assumed every consultant might need to access it. Actual utilization analysis showed average concurrent usage was 45 licenses, peak usage was 75 licenses. The firm paid for 200 licenses when 100 concurrent licenses would have been sufficient. Annual license cost: $1.2M/year × 50% waste = $600K wasted annually.
Mechanism 2: Organizational Changes Without License Reallocation
When an organization restructures, employees leave, or roles change, licenses often don’t follow. A database administrator retires; their Oracle Database license remains allocated to a terminated user account but continues to be maintained and tracked as an active license. A department closes; its 50 software licenses sit on the “inactive” shelf, but the company continues paying annual maintenance fees because decommissioning requires vendor agreements or documentation to remove them from contracts.
Typical scenario: A company acquires three smaller businesses and consolidates them into a unified platform within 18 months. During the integration, licenses from the original parent company, Acquisition 1, Acquisition 2, and Acquisition 3 all remain on the books. Finance doesn’t have centralized visibility into which licenses are active, which are duplicative, and which belong to terminated employees. The result: licenses from organizational layers that no longer exist continue to be maintained and paid for.
Mechanism 3: Specialty/Niche License Purchases That Become “Shelfware”
Technical teams purchase specialized software for specific projects. The project concludes; the license remains on the books. A data scientist licenses a specialized statistical analysis tool for a 3-month project. The project ends; the license continues at annual renewal. An engineer licenses specialized CAD capabilities for an automotive contract. The contract concludes; the license renewal bill arrives automatically.
Without disciplined license management processes, these “shelfware” licenses become background expenses—small individually ($2K-$10K per license per year) but massive in aggregate. For an organization with 50 employees where 5-10 people have purchased specialized licenses for completed projects, annual shelfware costs accumulate to $25K-$75K.
Mechanism 4: Multiple Solutions Purchased for Same Problem
Different departments or divisions independently solve the same problem, resulting in multiple overlapping licenses. Company buys Tableau for data visualization; another division buys Looker for the same purpose. Finance department operates on SAP; operations department purchases a different ERP platform. HR has Workday; Finance has Kronos. No centralized procurement function prevents redundant solutions from being purchased, and once purchased, switching costs and organizational inertia prevent consolidation.
Financial impact: If Finance licenses SAP ($500K-$2M annually depending on contract size) and Operations licenses Oracle ($300K-$1M annually), and they overlap in functionality for 40% of use cases, the organization is duplicating $200K-$800K in annual software spending for overlapping capabilities.
Mechanism 5: Upgraded Tools Without Retiring Legacy Solutions
When organizations implement new software, they frequently don’t retire the legacy system they’re replacing. The migration strategy becomes “run parallel systems for 6-12 months to ensure stability.” Twelve months later, when they should transition fully to the new system, the old system is still running. Six months later, both systems are maintained for “insurance” against data loss. Two years post-implementation, the organization still pays for both the legacy system ($100K-$300K annually) and the new system it was meant to replace.
Real-world example: A financial services company implemented a new cloud-based financial planning and analysis (FP&A) tool ($150K annually) but kept the legacy on-premise system ($120K annually for licenses and maintenance) as a “backup.” Three years post-implementation, both systems are still active, representing $270K in annual spending where $150K would have been sufficient.
Quantifying the Waste: What 48% License Redundancy Actually Means
For a PE-backed company with $50M in revenue and typical software spending of 8-12% of operating expenses:
| Company Profile | Annual Software Spend | 48% Waste Amount | Lost EBITDA Opportunity |
|---|---|---|---|
| $50M revenue, 10% spend | $5M | $2.4M | 4.8% of EBITDA |
| $100M revenue, 12% spend | $12M | $5.76M | 5.8% of EBITDA |
| $200M revenue, 10% spend | $20M | $9.6M | 4.8% of EBITDA |
| $500M revenue, 10% spend | $50M | $24M | 4.8% of EBITDA |
For a $100M revenue company with typical 15% EBITDA margins ($15M EBITDA) and 12% software spending, a 48% waste rate represents $5.76M in annual optimization opportunity—equivalent to 38% of total EBITDA. This is not incremental margin improvement requiring operational changes; this is direct cost elimination requiring only license audits, consolidation, and renegotiation.
Specific Licensing Patterns Creating Highest Waste
Not all software licenses create equal waste. Certain licensing models and categories concentrate waste disproportionately.
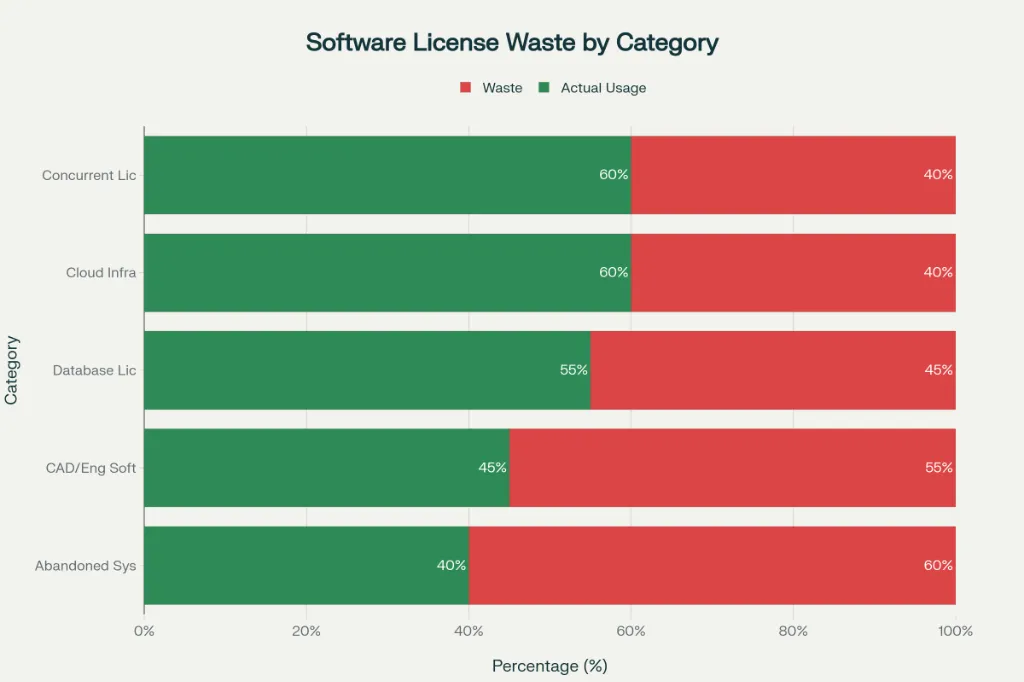
Category 1: Engineering and Specialized Software (Highest Waste)
CAD, CAE, EDA, CAM, PLM, simulation software, and other engineering tools represent some of the highest-cost, most frequently underutilized licenses.
Why underutilization is high:
- Engineering tools are expensive ($3K-$15K per seat annually for premium tools)
- Usage is often project-specific, not continuous
- Organizations over-buy to ensure availability during project peaks
- Licenses are frequently perpetual or multi-year commitments, creating inertia around decommissioning
Typical waste pattern: A manufacturing company with 200 employees purchases 100 licenses of specialized CAD software at $10K per license ($1M annually). Actual peak concurrent usage: 45 licenses. Baseline usage: 25 licenses. Wasted spend: $550K annually (55% waste rate).
Category 2: Cloud Infrastructure and Compute (Growing Waste)
Cloud computing services (AWS, Azure, Google Cloud) are increasingly provisioned with over-conservative estimates, leading to systematic overprovisioning.
Why overprovisioning occurs:
- Teams provision for peak demand without understanding typical usage
- Auto-scaling isn’t configured, so infrastructure remains at peak capacity
- Reserved instances are purchased for capacity that’s rarely needed
- Multiple services are purchased “just in case” departments need them
Typical waste pattern: A company provisions cloud infrastructure for 100% expected peak demand but runs at average 40% capacity. Annual cloud bill: $2M. Optimization opportunity: 30-40% ($600K-$800K) through rightsizing.
Category 3: Concurrent/Floating Licenses (Moderate to High Waste)
Floating licenses (licenses available to any user who needs them) are frequently over-purchased because procurement teams buy for theoretical simultaneous peaks rather than actual concurrent usage.
Why waste occurs:
- Procurement teams overestimate peak concurrent users by 20-40%
- License usage data isn’t available, so decisions are made on assumptions
- Concurrent user reductions happen gradually; licenses aren’t adjusted correspondingly
Typical waste pattern: Organization licenses 150 concurrent users of a $5K per user platform ($750K annually). Actual peak: 90 users. Wasted spend: $300K (40% waste).
Category 4: Database and Server Licenses (Complex Licensing Creates Waste)
Oracle, SAP, and Microsoft licenses are complex; licensing terms include per-core, per-server, per-user, and per-processor-socket metrics, creating opportunities for both accidental misunderstanding and vendor exploitation.
Why waste is high:
- Customers often don’t understand their license entitlements
- Vendors use audits to find underreporting, triggering true-up fees
- License agreements change; customers operate under outdated terms
- Multi-core processors inflate license requirements (Broadcom’s VMware acquisition doubled core requirements per license in 2023)
Real-world example: A financial services firm inherited Oracle licenses from an acquisition. During a post-close audit, discovered they were using Oracle on VMware with per-core licensing (more expensive than per-server licensing they’d budgeted for). Audit found $500K true-up fee. Post-acquisition, the firm negotiated with Oracle and renegotiated VMware licensing, reducing annual spend by $800K.
Category 5: Abandoned or Partially Implemented Systems
When organizations implement new systems but don’t fully replace legacy systems, they frequently maintain both for years, creating duplicate costs.
Why this waste pattern:
- Organizational reluctance to decommission legacy systems (“What if we need it?”)
- Parallel operations to ensure stability during transitions
- Organizational changes trigger delays in migration plans
- Systems aren’t formally decommissioned, so maintenance contracts renew indefinitely
Typical waste pattern: Finance implements new Workday for HR; maintains legacy PeopleSoft for 2+ years as “backup.” Annual combined cost: $400K (new system) + $150K (legacy system) = $550K. Optimization opportunity: $150K annually by decommissioning legacy system.
The Audit and Optimization Process: Capturing the Value
Quantifying and capturing software licensing waste requires structured assessment and negotiation.
Phase 1: License Inventory Audit (Week 1-2)
- Activities:
- Compile complete software license inventory across organization
- Identify licenses by category (perpetual vs. subscription, per-user vs. concurrent, etc.)
- Document annual costs for each license
- Identify license holder/owner for each item
- Output: Centralized software inventory with annual costs; identification of data gaps
- Key question: Can you account for every software license in use? If not, you’re definitely paying for licenses you don’t know about.
Phase 2: Utilization Analysis (Week 2-4)
- Activities:
- For each significant software license, gather usage data
- Use software’s own analytics tools (most enterprise software tracks usage)
- Interview users about real usage patterns vs. allocated licenses
- Identify concurrent licenses in use at peak times
- Output: Usage baseline; identification of underutilized licenses
- Critical discovery: Zylo found 55% of enterprise software licenses go unused; Openit found 48% waste on average. Most organizations discover 20-40% of their licensed software is underutilized.
Phase 3: Redundancy and Overlap Identification (Week 4-5)
- Activities:
- Identify overlapping functionality across multiple tools
- Document which systems serve same business function
- Interview departments about system usage and satisfaction
- Assess switching costs for consolidation
- Output: Identification of consolidation opportunities; switching cost assessment
- Example: Finance uses Tableau for reporting; Operations uses Looker for same purpose. Both tools provide 80% overlap in functionality. Consolidation to single platform could eliminate $200K-$300K annually in duplicative spend.
Phase 4: Negotiation and Optimization (Week 5-8)
- Activities:
- Approach vendors with actual usage data; negotiate true-up/downgrade where applicable
- Consolidate licenses onto platforms with greater utilization
- Decommission unused and redundant systems
- Renegotiate contracts based on validated usage
- Output: Optimized licensing agreements; reduced annual software spending
- Typical outcomes:
- 20-30% reduction in software spending (industry average across successful optimizations)
- Elimination of $1-5M annually in wasted licenses for mid-market companies
- Consolidation of overlapping systems onto single platforms
Real-World Case Studies: What Optimization Actually Delivers
Case Study 1: Manufacturing Company CAD License Consolidation
Pre-optimization:
- 100 CAD licenses at $10K each = $1M annually
- Peak concurrent usage: 45 licenses
- Actual average usage: 25 licenses
- Cost per actually-used license: $40K
Optimization process:
- Conducted usage audit; identified 55% underutilization
- Negotiated with vendor from 100 licenses to 50 concurrent licenses
- Implemented seat rotation program for occasional users
- Decommissioned unused specialization modules
Post-optimization:
- 50 concurrent licenses at $9.5K each = $475K annually
- Annual savings: $525K (52.5% reduction)
- EBITDA improvement: $525K
- Implementation cost: $15K (audit/negotiation time)
- Payback: ~1 week
Case Study 2: Financial Services Cloud Infrastructure Rightsizing
Pre-optimization:
- Provisioned for 100% peak capacity
- Annual AWS bill: $2M
- Average actual utilization: 40%
- Reserved instances for capacity rarely used
Optimization process:
- Analyzed 12 months of usage data
- Identified 40% overprovisioning
- Rightsized compute capacity to 65% of peak
- Implemented auto-scaling for variable loads
- Purchased reserved instances only for baseline capacity
Post-optimization:
- Annual AWS bill: $1.25M
- Annual savings: $750K (37.5% reduction)
- Implementation cost: $50K (consulting/optimization)
- Payback: 3 months
Case Study 3: Global Tech Company Duplicate Platform Consolidation
Pre-optimization:
- Finance: Tableau for analytics ($150K annually)
- Operations: Looker for analytics ($140K annually)
- HR: Workday ($200K annually)
- Legacy HR system: PeopleSoft ($150K annually)
- Total annual spend: $640K
Optimization process:
- Audit identified Tableau/Looker overlap
- Identified Workday/PeopleSoft redundancy
- Negotiated Workday price reduction with Tableau integration
- Decommissioned Looker and PeopleSoft over 6-month transition
Post-optimization:
- Workday: $200K annually
- Tableau: $120K annually (renegotiated)
- Total annual spend: $320K
- Annual savings: $320K (50% reduction)
- Implementation cost: $75K (migration/training)
- Payback: 3 months
PE Deal Structuring: Capturing Licensing Value at Close
Incorporating Software Licensing into Pre-Close Due Diligence
Most PE firms don’t assess software licensing redundancy during due diligence. Implementing licensing assessment as standard practice requires:
- Assign responsibility: Designate a procurement or IT lead to conduct software licensing inventory and usage analysis during diligence window
- Budget timeline: Allocate 3-4 weeks for comprehensive licensing audit (can be accelerated if needed)
- Request seller cooperation: Access to software inventory, license contracts, usage data, and IT systems
- Develop baseline: Create software licensing inventory and usage analysis as part of standard due diligence output
Adjusting Deal Economics for Licensing Optimization
Software licensing optimization opportunity should be reflected in deal structure:
Valuation impact:
- For target company with $5M annual software spend and 48% waste ($2.4M), adjust EBITDA for optimization opportunity
- If capturing optimization is probability-weighted at 80%, reduce EBITDA baseline by $1.92M (conservative approach)
- For company valued at 8x EBITDA, this creates $15.36M valuation adjustment
Earnout structure (if applicable):
- Tie earnout achievement to software licensing optimization
- Example: “Earnout paid based on achievement of $1.5M software cost reduction by Month 6”
- This ensures seller cooperates with optimization vs. incentivizes post-close disputes
Purchase price adjustment (if applicable):
- Establish baseline software costs as of close
- Any true-ups discovered post-close (vendor audits, hidden licenses) are deducted from purchase price
Post-Close Optimization: 100-Day Plan
For a PE-backed company acquiring software-intensive business, 100-day optimization plan should include:
Month 1: Audit and Inventory
- Complete software licensing inventory (all systems, contracts, costs)
- Gather 12 months of historical usage data
- Interview key stakeholders about system satisfaction and utilization
- Identify obvious redundancies and underutilized licenses
Month 2: Negotiation and Planning
- Prepare vendor negotiations with actual usage data
- Approach vendors; present consolidated licensing proposal
- Plan system decommissioning for redundant platforms
- Establish switching timeline for consolidation efforts
Month 3: Execution and Realization
- Close vendor negotiations; implement license reductions
- Begin decommissioning redundant systems
- Implement new license tracking and governance processes
- Calculate realized savings; track against targets
Expected outcome: $500K-$2.5M annual savings for typical mid-market acquisition; 20-30% reduction in overall software spending
Recommendations for PE Firms
-
Make Software Licensing Assessment a Mandatory Due Diligence Component Add software licensing to standard acquisition checklist alongside financial, legal, and operational due diligence. Allocate 3-4 weeks for comprehensive assessment.
-
Develop Internal Software Asset Management Capability Either develop in-house software licensing expertise or establish retainer relationship with software asset management firm. This enables systematic optimization across entire portfolio.
-
Implement Software License Management Platform Across Portfolio Rather than relying on manual tracking, implement centralized software asset management platform (Zylo, Zluri, Open iT, etc.) to track usage, identify optimization opportunities, and manage renewals across portfolio companies.
-
Build Software Licensing KPIs into Portfolio Monitoring Track:
- Total software spending as % of revenue
- Software waste percentage (target: <20% vs. current 48% average)
- License utilization rates by major platform
- Software vendor renegotiation cycle management
-
Coordinate Software Licensing Across Portfolio for Synergies Aggregate software licenses across portfolio companies to negotiate volume discounts with major vendors (Microsoft, Adobe, Salesforce, etc.).
-
Establish Software License Governance Post-Close
- Centralized procurement approval for new software licenses (prevent unauthorized purchases)
- Quarterly software utilization reviews
- Annual license true-up and renewal planning
- Formal decommissioning process for retired systems
Conclusion: The Hidden EBITDA Lever
Software licensing redundancy represents one of the most consistent and immediate EBITDA improvement opportunities available in PE acquisitions. The 48% waste rate isn’t an anomaly; it’s the systematic result of how software licenses accumulate in operating organizations without disciplined management.
PE firms that systematically assess software licensing during diligence, incorporate findings into deal economics, and execute post-close optimization plans will capture 4-7% EBITDA improvement opportunities that competitors overlook. For a $100M revenue acquisition, this represents $2-7M in annual EBITDA improvement—equivalent to 1-3x initial MOIC across a 5-year hold period.
The competitive firms will make software licensing assessment as routine as financial due diligence, treating it not as a post-close operational concern but as a day-one value creation opportunity.
References and Source Data
- Openit 2025; organizations with 200+ employees waste $235,000 annually (48% of software budget); general average $79,639 annually (33% of budget)
- Zylo’s 2024 Enterprise SaaS Management Report; 55% of enterprise software licenses go unused; average $127.3M wasted annually for large enterprises
- Openit 2025; only 38% confident in collecting accurate usage data; 62% lacking systematic tracking
- Broadcom VMware acquisition (2023); core allowance reduced from 32 to 16 cores per license, doubling license requirements
- Additional sources: ASME 2025 Engineering Software License Analysis; E78 Partners tech-driven value creation (20-30% software spend waste); Liepert 2024 Study on IT Cost Optimization and EBITDA in PE (scielo.org.co); Vista Equity Partners, Blackstone Group case studies on software cost optimization; 2-Data Oracle Licensing M&A Scenarios 2025; Redress Compliance Oracle License Audit Defense 2025; SAP Rise Negotiations 2025 Audit Defense Guide; Flexera IT Asset Management 2025