Key Person Dependencies and Talent Attrition: How Technical Talent Loss Destroys PE Value Creation
Why acquired technical talent leaves at 2x the rate of non-acquired employees, and how this 'invisible' asset loss destroys value creation timelines.
When a PE firm closes on a software, technology, or growth-stage acquisition, it acquires not just an operating business but a collection of highly specialized human capital: the architects who designed the system, the lead engineers who built the core infrastructure, the product managers who understand customer needs intimately, the senior technologists who carry institutional knowledge that exists nowhere else in written form. On Day 1, these individuals hold the institutional memory, technical expertise, and execution capability that make the business valuable. By Month 12, many of them are gone—and with them, a disproportionate amount of the value creation thesis.
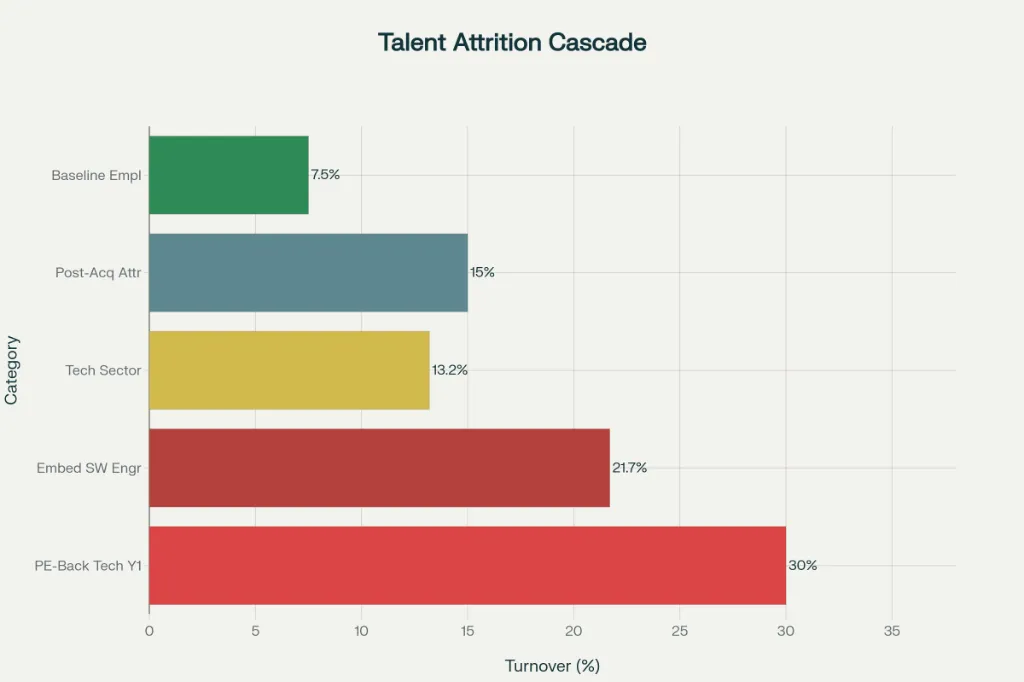
The data is stark and consistent: Acquired employees are nearly twice as likely to leave post-deal compared to non-acquired employees, with attrition spiking dramatically in the first 12 months post-close. For software and technology-intensive companies, engineering-specific attrition reaches 21.7%—above the 13.2% technology sector average—with embedded systems and critical technical roles experiencing even higher turnover. For a PE firm acquiring a software company with 50 engineers and assuming that 10-15 key technical staff will leave in the first 12 months, each departure cascades across the business: knowledge of critical system architecture walks out the door, feature development velocity collapses, new hires require 16-20 weeks to reach productive capacity, and the value creation timeline extends 6-12 months.
The financial impact is extraordinary. Replacing a senior engineer costs 150-400% of annual salary when accounting for direct replacement costs, productivity loss during ramp-up, and knowledge transfer loss. A single senior architect departure represents $160K-$300K in direct costs, multiplied by 3-6 months of reduced team productivity, multiplied by the cascading impact on teams dependent on that architect’s knowledge. For a PE-backed SaaS company with 40 engineers where 6 senior architects and tech leads depart in Year 1, the aggregate talent loss represents $1-2M in direct costs plus 12-24 months of productivity drag that delays feature delivery and revenue growth.
Yet most PE firms treat talent retention as a post-close operational concern rather than a pre-close deal risk. Only 40% of PE firms conduct detailed talent risk assessment during due diligence. Even fewer incorporate talent risk into valuation or structure retention mechanics into deal terms. The result: PE firms systematically overpay for acquisitions where technical talent is a critical value driver, then watch that talent evaporate as organizational change and uncertainty trigger departures.
This article deconstructs key person dependencies and talent attrition in PE acquisitions: why technical talent leaves post-close despite retention bonuses, what the true cost of technical talent departure represents, how to identify which talent is truly critical versus replaceable, and how to structure deals and post-close operations to actually retain the talent that drives value creation.
Why Technical Talent Leaves: The Four-Part Departure Trigger Model
Technical talent doesn’t leave randomly. Departures follow predictable patterns driven by organizational change, uncertainty, and misalignment with the new owners’ vision. Understanding these triggers enables PE firms to identify and retain the talent most at risk.
Trigger 1: Organizational Uncertainty and Lack of Clear Communication
The period immediately post-close is characterized by organizational chaos and uncertainty. Employees don’t know what the PE ownership means for them personally. They have questions: Will I be laid off? Will my compensation change? Will I report to a new management team? What happens to my stock options? Am I part of the long-term plan or on the chopping block?
In the absence of clear communication from leadership, employees fill the information vacuum with rumors and fear. Within days of close, the rumor mill activates: “I heard they’re consolidating finance teams—half the controllers are getting laid off.” “Someone said the CTO is leaving, so the new owners are bringing in their own tech team.” “The acquisition price was lower than expected—maybe they’re not serious about growing.” These rumors, often entirely false, create psychological pressure that drives immediate departures by employees who have optionality (senior technical people, usually).
The talent most vulnerable: Senior engineers, architects, and technical leaders who have resume value and can find other jobs quickly. Junior and mid-level engineers, lacking external options, typically stay longer and wait to see what happens.
Timeline: First 30 days post-close. If you don’t have clear, consistent communication from Day 1, talent loss accelerates immediately.
Real-world pattern: A FinTech PE acquisition closed on a Monday. By Friday, two of the four senior engineers managing the core trading system had verbally committed to other companies. Both left within six weeks. When interviewed about their departures, both said: “We had no idea what the new owners wanted. The original founder said he’d stay, but nobody said what role we’d play. We decided not to wait around to find out we weren’t needed.”
Trigger 2: Founder/Key Person Departure and Loss of Cultural Continuity
Many founder-led companies emphasize culture and mission as primary retention mechanisms. Employees are attracted to working with the founder, being part of a mission-driven team, or being part of a specific vision. When the founder departs post-close (which happens in 75% of cases according to AlixPartners), the cultural anchor disappears. Employees who stayed through the acquisition because “the founder said the PE firm was great” suddenly lose that endorsement.
Similarly, when the first CTO leaves (common timing: within 3-6 months post-close), technical teams lose their leader and often fragment. Engineers who were loyal to the CTO, not the company, follow him to the next opportunity. Knowledge transfer breaks down because the CTO, the person responsible for onboarding and mentoring, is gone.
The talent most vulnerable: Teams that were built around a strong leader (CTO, VP Engineering, head of product) lose cohesion when that leader departs.
Timeline: Months 1-6. Initial departures by the key person trigger secondary wave of departures by team members.
Real-world pattern: A SaaS company’s 50-person engineering team was led by a CTO who had built a strong culture of mentorship and technical leadership. When the CTO departed 6 months post-close (he negotiated a 6-month earn-out period but chose to leave after the earnout vested), his departure triggered a cascade: his direct reports started interviewing elsewhere immediately; by Month 9, five engineers had left; by Month 12, ten engineers had departed—a 20% attrition rate in the senior engineering ranks. The new CTO brought in by the PE firm spent the next 12 months rebuilding team cohesion and knowledge management systems.
Trigger 3: Misalignment Between Compensation and Post-Acquisition Expectations
Pre-acquisition, employee compensation often reflects the company’s stage and financial position. A pre-Series-C startup might offer junior engineers $100K salary + modest equity that’s mostly underwater. A Series B SaaS company might offer mid-level engineers $140K + stock options representing 0.01% of the company.
Post-acquisition, employees discover their equity was dramatically diluted by the PE acquisition (PE takes a substantial equity stake), or the earnout structure means their pre-acquisition stock options vest on a different schedule than they expected, or their cash compensation doesn’t change despite post-acquisition organizational changes that increase their responsibility. An engineer who thought they’d be a technical lead now reports through two management layers and has seen other senior people hired at higher levels. An engineer who anticipated a promotion post-acquisition doesn’t get it because the PE firm reorganizes and promotes external hires.
The talent most vulnerable: Senior engineers and architects whose equity was meant as a retention mechanism. They expected significant value from the acquisition; instead, their equity is diluted and has uncertain exit timing. These people have the most to lose from equity misalignment and the most optionality to leave.
Financial impact: A software company was acquired by a PE firm for $400M. Employees’ equity represented 0.5% of pre-acquisition equity. In the post-acquisition reorganization, the PE firm increased their stake from 60% to 80%, diluting existing shareholders by 20%. An engineer’s 0.5% became 0.4%. The engineer was told their equity would vest over the 5-7 year hold period, but discovered it would be re-struck at a higher valuation post-close. The engineer left within 6 months, taking his architectural knowledge of the core platform with him.
Trigger 4: Rapid Organizational Change and Leadership Turnover
PE ownership typically triggers rapid organizational restructuring: reporting lines change, new executives are brought in, redundant positions are eliminated, and the organization is “optimized.” While many of these changes are necessary and improve efficiency, they create uncertainty for technical talent. An engineer reporting to the original VP Engineering now reports to a new Chief Technology Officer brought in by the PE firm. The engineer doesn’t know the new CTO, isn’t confident in their ability, and doesn’t have established trust. Rather than wait to see if the relationship works, the engineer interviews elsewhere.
Additionally, rapid leadership turnover compounds uncertainty. If the new CTO leaves after 6 months, replaced by another external hire, and then the new VP of Product leaves after 8 months, replaced by a third external hire, the technical team loses confidence in leadership stability. At this point, senior engineers leave proactively, knowing that further organizational instability is likely.
The talent most vulnerable: Technical leaders and architects who worked closely with departed founders or original CTOs. These people have the most experience with the original direction and the most likely to clash with new leadership brought in by PE.
Timeline: Months 2-9. Initial leadership appointments trigger departures; subsequent management changes trigger secondary waves.
Real-world pattern: A healthcare tech company experienced four CTO/VP Engineering transitions over 18 months post-acquisition. The first CTO (original founder) departed at Month 6. A replacement was brought in from the PE firm’s network at Month 8; he clashed with the product team and left at Month 14. Another external hire came in at Month 16. By Month 18, six of the company’s ten senior engineers had departed, citing lack of engineering leadership stability. The company spent Months 18-30 rebuilding the engineering team and re-establishing technical direction.
The True Cost of Technical Talent Loss
PE firms often model retention costs as straightforward economics: a retention bonus of $50K-$100K should be sufficient to keep key talent for 12-18 months. But the true cost of technical talent loss extends far beyond direct recruitment and compensation costs.
Direct Replacement Costs
Hiring a replacement engineer involves:
- Recruitment costs: $15K-$30K for external recruiters, job postings, interviewing coordination
- Hiring manager time: 40-60 hours at $150-250/hour = $6K-$15K
- Onboarding and training: 2-3 weeks at 60% productivity + training materials and documentation = $10K-$20K
- Total direct replacement cost for mid-level engineer: $31K-$65K
For senior/specialized engineers, these costs scale significantly:
- Senior architect replacement cost: $50K-$150K direct costs
Productivity Loss During Ramp-Up
The newly hired engineer doesn’t reach productive capacity immediately. Industry research shows:
- Weeks 1-4: 25% productivity (75% of salary is wasted)
- Weeks 5-12: 50% productivity (50% of salary is lost productivity)
- Weeks 13-20: 75% productivity (25% of salary is lost)
- Weeks 21+: 100% productivity
For a $120K mid-level engineer:
- First 20 weeks: $9K in direct lost productivity
- Ramp-up timeline is 16-20 weeks
- Actual productive capacity reached by Month 5-6
For a $200K senior engineer:
- First 20 weeks: $15K in direct lost productivity
- Actual productive capacity reached by Month 6-9
Knowledge Transfer Loss and Team Productivity Impact
The departing engineer possessed knowledge that doesn’t exist in documentation:
- Architectural knowledge: How the system actually works (vs. how the documentation says it works); what decisions were made and why; what alternatives were rejected and why
- Critical relationships: Customer relationships, vendor contacts, institutional knowledge about customer-specific implementations
- Problem-solving patterns: How to debug issues in the system; common failure modes; undocumented workarounds
- Team dynamics: Who in the company knows what; how to coordinate across teams; informal decision-making processes
When that knowledge departs, remaining team members must spend time reverse-engineering that knowledge. A feature that the departed engineer would have implemented in 1 week takes a remaining engineer 2-3 weeks because they must first understand the architectural context, investigate how similar features were implemented, and potentially ask customers about undocumented requirements.
Financial impact of knowledge loss: For a team of 10 engineers where one senior architect departs:
- Each remaining engineer spends 5-10% of their time on knowledge recovery (investigating how the system actually works, how to solve problems the departed architect would have solved)
- 10 engineers × 5-10% × $120K average salary = $60K-$120K annually in lost productivity
For a 40-engineer team where 6 architects/leads depart:
- Remaining engineers collectively spend 15-20% of their time on knowledge recovery and re-learning
- 40 engineers × 15-20% × $120K average = $720K-$960K annually in lost productivity
Aggregated across the team over 12 months: $720K-$960K in knowledge loss costs plus the compounding effect that features take 40-60% longer to build because critical knowledge is missing.
Timeline Impact and Value Creation Delay
Technical talent loss cascades into timeline delays:
Scenario: A PE-backed SaaS company plans to launch 3 major features in Year 1 to drive $5M revenue growth. Each feature was to be owned by a senior architect + a team of mid-level engineers.
Two of the three architects leave in Months 2-4. The company must:
- Hire replacement architects (6-12 week timeline)
- Get replacement architects up to speed on existing architecture (4-6 weeks)
- Resume feature development now 3-4 months behind original plan
Result: Instead of launching Feature 1 in Month 6, it launches in Month 10. Instead of generating $5M in revenue in Year 1, revenue growth is $3M (60% shortfall). The value creation timeline extends from Year 2 to Year 3.
For a PE firm modeling 3.5-4x returns over 5 years, a 12-month delay in revenue growth acceleration extends the value creation window, compresses the exit timeline, and reduces achievable exit multiples. A $5M revenue acceleration in Year 1 supports a 1-2x multiple uplift in exit valuation; if that acceleration is delayed to Year 2, the uplift is reduced and the exit timing is pushed back.
Quantifying the Total Cost
The complete cost of losing a senior engineer includes:
| Cost Component | Amount |
|---|---|
| Direct replacement costs | $50K-$150K |
| Onboarding/training (new hire) | $10K-$30K |
| Productivity loss during ramp-up (20 weeks) | $15K-$40K |
| Knowledge transfer loss to remaining team (first 6 months) | $50K-$150K |
| Feature delivery delays and timeline impact | $100K-$500K (depending on role criticality) |
| Total tangible cost | $225K-$870K per senior engineer departure |
For a company with 10 senior/critical engineers where 3 depart in Year 1:
- Total talent loss cost: $675K-$2.6M
- Equivalent to 5-20% of EBITDA for a typical growth-stage software company
- Equivalent to 12-36 month delay in value creation timeline
Identifying Critical vs. Replaceable Talent
Not all technical talent departures are equally damaging. A critical departure (architect of core system, only person who understands a subsystem, key relationship owner) has catastrophic impact. A replaceable departure (junior developer, person with redundant skills) has minimal impact.
PE firms often fail to distinguish between these categories, leading to over-compensation of replaceable talent (paying expensive retention bonuses to junior engineers) and under-retention of critical talent (losing architects because no retention strategy targets them).
The Criticality Assessment Framework
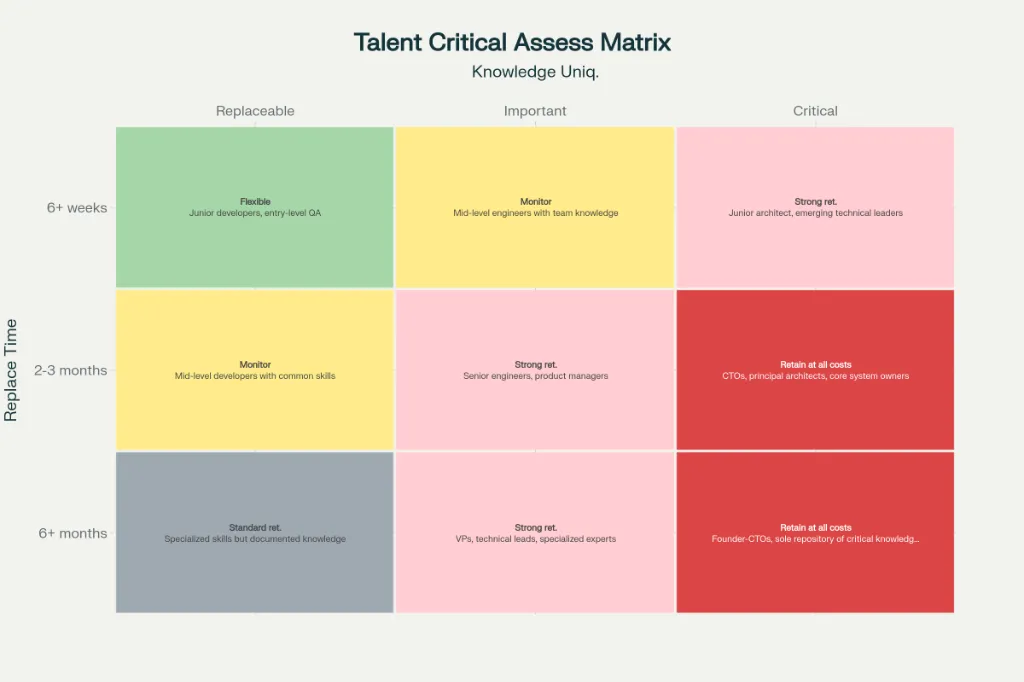
During due diligence and immediately post-close, PE firms should assess each technical team member across three dimensions:
Dimension 1: Knowledge Uniqueness
- Critical (Red): Only person who understands a core system; architect of critical infrastructure; sole owner of customer relationships or implementations
- Important (Yellow): Could be replaced given 3-6 months; their knowledge exists in team but isn’t deeply documented; multiple people could learn their role
- Replaceable (Green): Skills are common; knowledge is documented; multiple people in the market have equivalent skills
Dimension 2: Timeline to Replace
- Critical (Red): Would take 6+ months to hire and onboard a replacement with equivalent capability; significant productivity gap during replacement
- Important (Yellow): Would take 2-3 months to replace; some productivity gap
- Replaceable (Green): Could replace within 4-6 weeks; minimal productivity gap
Dimension 3: Impact on Value Creation
- Critical (Red): Departure would delay value creation timeline by 6-12 months; impact revenue growth, feature delivery, or customer retention
- Important (Yellow): Departure would cause 2-4 month delays; moderate impact on timeline
- Replaceable (Green): Departure has minimal impact on timeline or value creation
Building the Critical Talent Map
A typical 50-person software engineering organization might break down as:
- 5-7 Critical (Red) people: architects, senior technical leaders, key customer relationship owners
- 10-15 Important (Yellow) people: mid-level engineers with specialized knowledge, product managers with customer insight
- 28-35 Replaceable (Green) people: junior developers, entry-level positions, people with generally available skills
PE retention strategy should heavily weight the Critical and Important categories while being more flexible with Replaceable talent.
Structuring Retention: The Mechanics That Actually Work
Most PE firms use blunt retention mechanisms (one-time cash bonuses, continued equity participation) that don’t actually work. Better retention structures align incentives with value creation and address the psychological reasons people leave.
Ineffective Retention Mechanism #1: One-Time Cash Bonuses
“Stay for 12 months and receive a $100K bonus.”
Why it fails: A $100K bonus sounds significant on close day, but as organizational uncertainty develops (triggering Departure Trigger #1 above), the bonus becomes less compelling. An engineer thinking “I’m uncertain about this PE owner and the direction of the company” isn’t reassured by “$100K in one year.” The uncertainty remains. The bonus is merely compensation for staying through the uncertainty.
Additionally, once the bonus is locked in on paper, the person has a known financial incentive to leave immediately after the bonus vests. An engineer who received the bonus on Month 13 becomes a resignation risk on Month 13.
Ineffective Retention Mechanism #2: Continued Equity Participation
“Your equity continues to participate in the upside.”
Why it fails: Equity is a second-order priority for most technical talent after the acquisition closes. They would rather have clarity and an exciting future than speculate on exit multiples in Year 5. Additionally, post-acquisition equity re-strikes and dilution often make continued equity participation less attractive than it initially appeared.
Effective Retention Mechanism #1: Structured Promotion Path with Clear Levels
What it looks like:
- “You’ll advance to Staff Engineer level (publicly defined role) by Month 18”
- “Your team will grow from 5 to 8 people, and you’ll have promoted one person from junior to mid-level by Year 1”
- “You’ll be responsible for architecting our new real-time platform”
Why it works: Technical talent, especially mid-career and senior engineers, care deeply about career progression and increasingly meaningful work. A clear promotion path addressing “What does my future look like?” is dramatically more effective than a cash bonus addressing “How much are you paying me?” Mid-career engineers want to know they’re progressing; senior engineers want meaningful challenges. A “Staff Engineer to Principal Engineer” trajectory with increasing technical scope is compelling.
Timeline impact: Effective immediately. A promotion path is more motivating than a cash bonus.
Effective Retention Mechanism #2: Leadership Development and Mentorship Program
What it looks like:
- Structured program where senior engineers mentor and develop mid-level talent
- Executive coaching provided for engineers transitioning to leadership roles
- Annual professional development budget ($5K-$10K per engineer) for conferences, certifications, training
Why it works: Technical talent feels most engaged when they’re developing new skills and when the organization is investing in their growth. A PE firm investing in professional development sends a signal: “We’re serious about building this business; we’re investing in your future.”
Additionally, many technical leaders report that their primary retention motivator is the opportunity to mentor and develop junior talent. A program that formalizes and enables that motivation is highly effective.
Effective Retention Mechanism #3: Transparent Communication and Governance
What it looks like:
- Weekly engineering updates from the CTO directly to the team
- Monthly “State of the Company” updates explaining financial performance, growth, and strategic direction
- Clear communication about organizational changes before announcements, not after
- Regular one-on-ones between managers and direct reports addressing career progression, skill development, and role clarity
Why it works: The primary departure trigger is organizational uncertainty (Trigger #1). Transparent communication dramatically reduces that uncertainty. Engineers who understand the PE ownership, the business strategy, and their role in value creation are less likely to speculate about layoffs or organizational instability.
The Case for Pre-Close Talent Diligence
Most PE firms don’t conduct talent-specific due diligence before acquisition. The standard approach: assess the leadership team, evaluate management structure, confirm there are no key person dependencies that would break the deal. But this surface-level assessment misses critical talent risk.
What Comprehensive Talent Diligence Should Include
Mapping critical dependencies:
- Who owns each core system or subsystem?
- If that person left, how would the company continue operations?
- Who holds key customer relationships?
- Whose departure would most impact the value creation timeline?
Assessing retention risk:
- Which critical people are most likely to leave post-acquisition?
- What would motivate them to stay?
- What retention mechanisms would be most effective?
Evaluating talent infrastructure:
- Does the company have formal career paths or is career progression ad hoc?
- Are compensation levels competitive for the market?
- Is the company attractive to senior talent or known as a difficult workplace?
- How strong is the onboarding program?
Understanding cultural factors:
- Is the company founder-led? Is the founder planning to stay post-acquisition?
- What are the retention motivators for top talent (compensation, equity, mission, growth, technical challenges)?
- How strong is team cohesion?
Building Talent Risk Into Valuation and Deal Structure
Talent risk should be reflected in:
- Valuation adjustment: If the company has material key person risk (only CTO owns the architecture, only VP Product understands the roadmap), adjust valuation down 5-10%
- Retention reserve: If talent retention is critical to value creation, establish a retention pool (0.5-2% of purchase price) for retention bonuses, accelerated equity, or development programs
- Earnout structure: Tie earnout achievement to talent retention metrics, not just financial metrics. If the critical architect leaves, earnout is at risk.
- Seller reps/warranties: Include representation that the seller has disclosed all known plans by key personnel to depart post-acquisition
Actionable Recommendations
For Investment Teams
- Mandate talent diligence for all acquisitions where technical talent is a material value driver (software, technology, engineering-heavy companies)
- Conduct pre-close talent interviews with critical technical leaders to assess retention risk and motivations
- Build talent risk into valuation: Adjust valuations down for material key person dependencies or talent retention risk
- Create retention pools tied to specific retention targets: 85%+ of critical talent retained through Year 1, 80%+ through Year 2
- Establish clear post-close talent strategy communicated on Day 1:
- Promotion paths for key talent
- New leadership introductions and roles
- Professional development commitments
For Portfolio Company CFOs and COOs
- Conduct 30/60/90 day talent reviews assessing retention risk and identifying early warning signs of departures
- Establish weekly communication cadence from CEO/CTO to technical teams explaining strategy and vision
- Create career ladders with clear levels and promotion criteria, especially for technical tracks
- Implement mentorship and development programs to build engagement and retention
- Track leading indicators of attrition (engagement surveys, one-on-one sentiment, external interview activity) to identify at-risk talent before departures occur
Conclusion: Talent as a Strategic Asset
The PE firms that will outperform peers in technology and engineering-heavy acquisitions are those that treat talent not as an operational concern but as a strategic asset directly tied to value creation. The firms recognizing that:
- Talent retention is not a cost—it’s a value creation lever with direct impact on timeline and achievable exit multiple
- One critical engineer’s departure can cost $225K-$870K in direct costs plus 12-month timeline delays
- Transparent communication and career clarity are more effective retention mechanisms than cash bonuses
- Pre-close talent diligence is as critical as financial due diligence
…will systematically achieve higher retention of critical talent and faster value creation compared to peers treating talent as a post-close operational afterthought.
For portfolio company leaders and operating partners, the imperative is clear: Technical talent is your scarcest resource. Protect it, develop it, and align it with value creation. The firms that do will realize returns 20-30% higher than peers on comparable deals.
References and Source Data
- Goodwin Law 2025; Crunchbase data on post-M&A attrition showing 2x higher departure rates in first 12 months; employee attrition increases significantly during first year post-buyout
- Tech sector average 13.2% turnover; embedded software engineers 21.7% (Talent Rise 2025, Stack Overflow 2024 survey)
- FullScale 2025; mid-level engineer replacement 1.5-2.5x salary; senior/specialized employee replacement reaches 400% of annual salary (Applauz research 2025)
- Only 40% of PE firms conduct detailed talent risk assessment during due diligence (HR Morning and industry estimates)
- AlixPartners research: 75% of portfolio company CEOs leave after PE acquisition (Aspen HR 2025)
- Additional sources: Townsendsearch PE Talent Trends 2025; StantonChase PE Talent Acquisition 2025; Guru Startups Engineering Retention 2025; NU Advisory PE Talent Trends 2025; Goodwin Law M&A Talent Retention 2025; IQ Talent PE Infrastructure 2025; PE Human Capital Council 72% portfolio companies need talent infrastructure upgrades; McKinsey 25% higher leadership retention with formal development programs